thumbnail

The Low Volume Candle (LVC)

Posted by larosfx on 08 May 2017

I know there are many volume related threads here on FF, and some of them are still active.
However, I am opening this thread as a discussion area for a system idea provided by my old buddy hukam, in order to reach a completely tradeable system (auto, manual or both).

I am opening this thread under "Trading Discussion" forums as the idea is still in the analysis phase.

The system life cycle will go into 4 main phases:
1- Analysis Phase.
2- Design and Development Phase
3- Testing Phase
4- Implementation Phase

hukam a genius and generous member on FF, will be the main contributor to this thread.

I am posting here a draft of his idea as received:

Quote

we have to find low volume area on history (compare to

last 15 bar on 5min,
30 bars on 15min,
60 bars on 30min,
120 bars on 60min,
480 bars on 240min charts,

last 15 bar on 5min, we find any low voulme candle and its our target candle ( target candle open, close part is pin point in our strategy).
if candle price is down side, and 1:2 RR, then Low voulme candle (LVC) low part(open or close) + spread is our target.
if price is upside, and 1:2 or better RR, the target LVC upper part(open or close) + spread.

and this this logic applied to all tfs from 5min to 4H tfs
LVC (must be fresh from one part, either close or open should now not cover with any next candle, like fresh zone, wicks can be ignored)

second case if price go 50 pips against us.
if price when against us. its must be going to an old low voulme area
first case have to check any history on 5,15,30,240min is their any old LVC
if yes its our target
we will open new order with target OLD LVC -spread and % wise increment in lot size, so we must have profit when we close booth orders at same time.

open booth order reach in target zone we can close booth orders.

and this loop will be continue from 5-240min,

first loop will check 5min only.. then 15min and then 30min incase its required to find low voulme area.
and this loop also active when we need second hedge order to protect our exisiting order.
incase their is no old zone (then its pure some news, and second opsite order open with at 75pipsloss insted of 50pips loss)
if 75 loss - second order + first main order reach at some level booth can be closed
and main loop will be reactive again.

open source
Development done in this thread will be open source, unless indicated otherwise.

tools
Low Volume Candle Detector LVC Detector 04
download iindicator click here

Regards,

Khalil Abokwaik

compare with fibo timezone, fibo fantrend, fibo expansion & D W MN Line, recomended compare (select one) with Ob-Os, RSI, Volume better & Stochastic indicator


LVC 4, daily chart
Logic Fibo Ret + Exp Feat LVC for momentum

11:40 AM
thumbnail

detected reversal with fibonacci time zone

Posted by larosfx on 08 April 2017

Fibonacci time zone is altogether a different kind of technical indicator. The times zones are what the name says, add Fibonacci to the name and once again those are what the name say. And what the name says is time zones based out of Fibonacci services of numbers.
All other technical indicators analyze the price-action on time axis. Fibonacci time zone is one indicator which has no place for the price in its calculation. Read ahead and though this statement is correct but later we will prove that this statement is not 100% correct - 99.99%, yes. But then that 0.01% makes a HUGE difference.
Though now you already know what a Fibonacci series of numbers is but let's have a quick recap for the ready reference. As we have seen that Fibonacci series starts with 0 and 1 and then extended by adding the two prior numbers to get the next. By doing so it comes up as follows:

0, 1, 1, 2, 3, 5, 8, 13, 21, 34, 55, 89, 144, 233, 377, 610, 987... and so on.

Each number in the series is the sum of two prior numbers.
Fibonacci time zones are nothing but vertical lines at distances to these numbers. These lines divide your chart in zones with the width equivalent to Fibonacci numbers. Let's say you are working with daily chart, then the zones will have widths as follows:
1st time zone = 1 day
2nd time zone = 1 day
3rd time zone = 2 days
4th time zone = 3 days
5th time zone = 5 days
6th time zone = 8 days
7th time zone = 13 days
8th time zone = 21 days

.... and so on. If you are working with hourly chart then you can replace the "days" by "hours".
During a downtrend, click on an important low or trough and drag the mouse vertically up to a desired height and click again. You will see vertical lines defining the zones according to Fibonacci numbers come up on your chart.
During an uptrend, click on an important peak and drag the mouse vertically down to a desired depth and click again. You will see vertical lines defining the zones according to Fibonacci numbers come up on your chart.

What the Fibonacci Time Zones Signify
Well, the beginning of a new time zone is considered to be an area for the beginning of a major market movement. Most of the times it is expected to bring consolidation or reversal but you should mainly take it as an area to expect a major market move.

Is price not important for Fibonacci Time zones?
You have seen that we are just breaking the chart in time zones and price has not at come into the picture. But can we expect to forget about the price? Are these time zones completely independent of the price action? Well, on the face value it looks so but as mentioned above, it is not 100% correct. Price does come into the picture. But it comes into the picture only once - at the very beginning - the point of start from where you wish to break your chart into these zones.
The essence is that the starting point, from where you wish to draw the Fib time zones,  needs to be an important low or high during that period.

some images that explains the reversal or continuation condition of market direction

several indications to confirm the order

12:30 PM
thumbnail

Maping Market With Fibonacci Retracement, Expansion And TimeZone

Posted by larosfx on 28 February 2017

Untuk bisa dengan mudah atau dalam bahasa lebih kerenya menjadi seorang ahli, kita di tuntut untuk belajar, memahami, membaca (meskipun berulang2 sampai dapat memahami), meganalisa dan mencoba. Tidak ada sebuah keahlian dilakukan dengan INSTANT, semua membutuhkan proses, waktu dan disinilah dalam berproses inilah yang sering kita abaikan, banyak yang menempuh jalan pintas dan disitulah faktor resiko untuk salah lebih tinggi karena kebanyakan kita akan menggampangkan dan selalu menjadi follower dan bukan leader.

Sebenarnya tidak ada yang salah dalam proses kita belajar, apabila banyak menemukan kendala, kesalahan karena disitulah kunci untuk kita menjadi lebih berpengalaman. Semua teknik saya rasa sudah sangat bagus, tinggal pada diri seorang traderlah yang menyesuaikan dengan system mana, teknik bagaimana kita akan survive di dunia forex, 
Dengan menggunakan sebuah tool di MT4 ini saya rasa kita sudah bisa survive dalam berbisnis forex, tools ini sangat lengkap dan mudah di pelajari, bisa menggunakan 1 tools saja, apakah fibo retracement, expansion, expansion, fan ataupun kita gunakan secara lengkap (fibonacci cluster). 
contoh fibo timezone untuk analisa tren dan perubahan arah tren
Fibonacci Timezone
contoh fibo retracement dan expansion untuk maping market
Fibonacci Retracement & Expansion
contoh fibo fan untuk analisa batas pergerakan market
Fibonacci Fan
Belajar, memahami, menganalisa strategi, mencoba, temukan error itu lebih berharga daripada membully (membuang energi) sebuah teknik yang kurang cocok dengan gaya trader anda. semakin berpengalaman, waktu akan menjawab, anda akan menjadi seorang leader dalam berbisnis forex.

Dan tunjukkan keberhasilanmu kepada orang yang anda cintai (keluarga / orang tua), simpan dan rahasiakan. jangan anda tunjukkan pada khalayak, karena disitullah awal menjadi orang yang tinggi hati, tetaplah seperti padi, makin banyak berilmu (berisi) semakin merunduk. Apabila anda sudah mennjadi seorang ilmu, bagikan kepada yang memerlukan, lebih baik berguna bagi siapa saja  yang ingin menimba ilmu daripada berguna untuk sebagian orang saja.


1:18 AM
thumbnail

Menemukan Teknik Trade Secara Mandiri

Posted by larosfx on 25 February 2017

Kalau kita searching di google cukup banyak kita mendapatkan berbagai macam referensi baik berupa ebook, indikator, EA dengan gratis ataupun berbayar, adapula grup, website yang menyediakan panduan secara gratis baik web di dalam negri ataupun dari manca negara yang bisa kita jadikan awal pembelajaran ataupun mengasah teknik dalam trading.
Pada dasarnya teknik trade menurut hemat saya pribadi berasal dari diri kita sendiri, mengapa demikian....??? dikarenakan setiap trader lebih nyaman dan mudah menggunakan teknik apa yang di anggap paling mudah dan profitable, ini juga berkaitan dengan logic dan emosional (psikologi) dalam trade yang akan berpengaruh dalam trade real nantinya.

forex factory forum
Cobalah mengikuti dari beberapa forum terebut (recomended forex factory forum), kemudian pilihlah yang sesuai dengan gaya trading, kebutuhan dalam trading, indikator pendamping dll. gunakan indikator pendamping yang mudah dimengerti, simple dan tidak ribet sesuai dengan teknik masing masing trade.

Luangkan waktu untuk backtest strategy, hitung konsesus dari masing masing strategi yang bisa kalian terapkan, gunakan logika, cobalah menganalisa dan cobalah mencatat dalam buku kecil. coba dan cobalah pada metatrader demo, sampai bisa menemukan error strategy, mengapa kita cari error, karena kalau yang benar jangan di hitung, hitunglah faktor errornya sehingga suatu saat anda bisa tau / mengerti kapan masuk pasar (order) kapan keluar (take profit / loss) pasar.
Apabila anda malas dalam hal tersebut diatas, dan mengandalkan signal, lupakan trade, beralihlah bisnis lainya.
Mungkin untuk sebagai referensi trader dalam negri teman teman skalian bisa mencari atau googling
basic naked trade Mbah Nitra dan Om Alvin 9 naga, untuk yang suka menggunakan renko bisa menggunakan teknik Om Pupung, teknik wave, fibonacci, harmonic bisa bergabung dengan Yinyang Sniper (Fietra Prayoga), Fibonacci dan Moving Average bisa bergabung dengan tekniknya Om Gun (Kang Gun), Tokyo Samurai bergabung dengan grup tokyo samurai asuhan Agus Romadhoni (om Dhonic) dan cukup banyak lagi

bersambung............
5:21 PM
thumbnail

Quantum super channel with NN

Posted by larosfx on 22 February 2017

Quantum super channel with Ema Neural 

Submit by Larry 22/02/2017

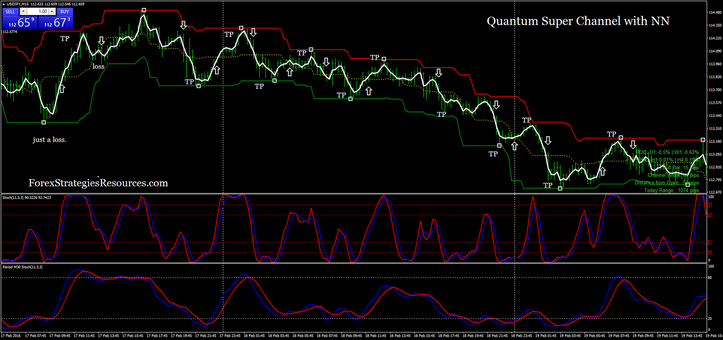
Quantum Super Channel with NN is a scalping or intraday trend momentum system HFT (High Frequency Trading). This system ois based on the Ema neural and Quantum Super Channel. This system is very profitable with low risk.
Time Frame 5 min and 15 min but you can use also at higher time frame.
There are two setting of this system: conservative and aggressive.


Metatrader indicators:
Quantum super channel,
Ema Neural,
Super Trader trend,
Stochastic oscillator (11, 3, 3,);
MTF Stochastic (11, 3, 3)

Trading rules Quantum Super Channel with NN
Aggressive

Buy
EMA Neural Crosses upward middle line of Quantum Super Channel confirmed by the two stochastic oscillators that cross upward.

Sell
Trading rules Quantum Super Channel with NN
Aggressive
Buy
EMA Neural Crosses dowward middle line of Quantum Super Channel confirmed by the two stochastic oscillators that cross downward.


Conservative
Trading only in the direction of the trend.
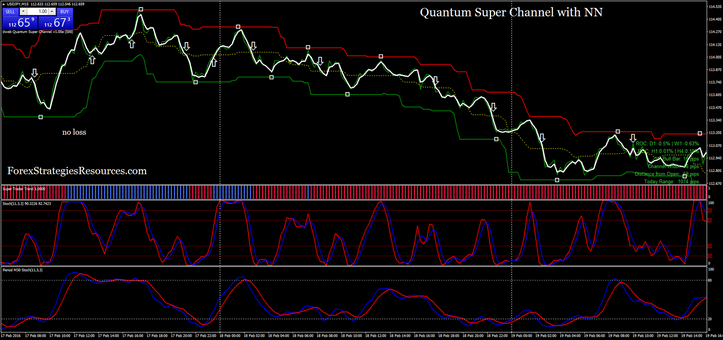
Trend up Super Trader trend blue bar.
Trend down Super Trader trend red bar.

Buy
Super Trader trend blue bar with the same previous conditions for trading

Sell
Super Trader trend red bar with the same previous conditions for trading.
Place initial stop loss at the last swing high/low, and place stop loss just above or below it.
Profit Target before the upper or lower channel or fast profit target.

Tip: TF 5 min, trade if the channel width is > 30 pips,

TF 15 min , trade if the channel width is > 35 pips.


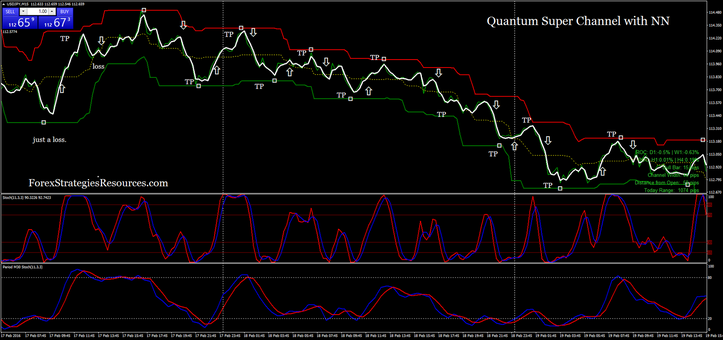
In the pictures Quantum Super Channel with NN in action.
Quantum Super Channel with NN
Quantum Super Channel with NN  line chart
Quantum Super Channel with NN line chart
Quantum Super Channel with NN  line chart conservative
Quantum Super Channel with NN line chart conservative
Download
Quantum Super Channel with NN.rar
compressed file archive 131.5 KB
1:08 PM
thumbnail

MA Bands Martingale Trading

Posted by larosfx on

Martingale Trading

Submit by Janus Trader 22/02/2017

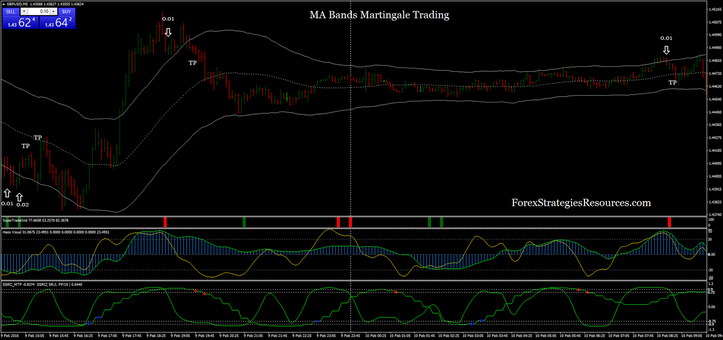
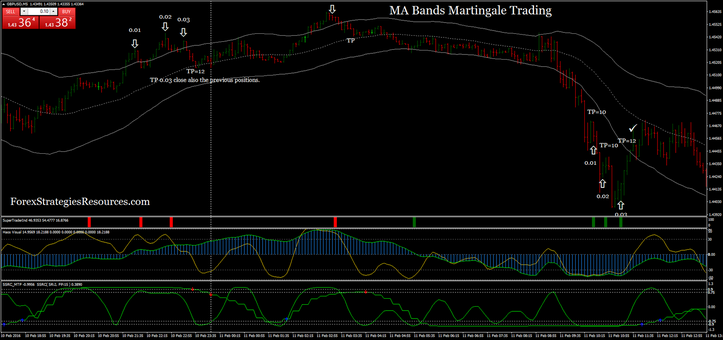
MA Bands Martingale Trading is an trend reversal strategy. This strategy have two reversal indicators.
Time Frame 5 min.
Currency pairs with low spreads not and Indices.

Apply this strategy at least on 4 currency pairs.


Metarader Indicators
MA Bands (MA period 56, ATR period 50, ATR multiplier 2.5:);
Super Trader Indi,
Haos visual mode
SSRC MTF (15 min) with SSRC.

Trading rules MA Bands Martingale Trading

Buy
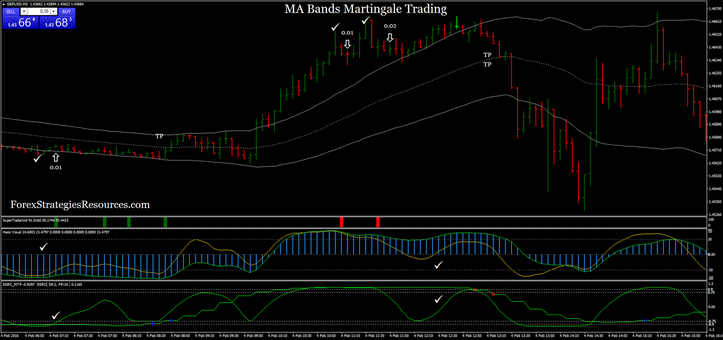
When the price broken the lower band, wait the green bar of super trader indicator confirmed by Haos visual with yellow line above green line or confirmed by SSRC above SSRC MTF.

Sell
When the price broken the upper band, wait the red bar of super trader indicator confirmed by Haos visual with yellow line below green line or confirmed by SSRC below SSRC MTF.

Note: When you are trading in one direction and the price of a signal touches the targetprofit, the counting the martingale, it begins 0.01.
When the last open position reaches the profit, also close earlier opened positions.
Increase profit target of two pips each new open position from the third position open in the same direction.
Example (10 TP 1, TP 2 10, 3 TP 12, TP 14 4, 16 TP 5, TP 6 18).
Close any open position to the opposite signal.

Profit Target 10 pips GBP/USD, 9 pips EUR/USD, 9 pips USD/JPY, 8 pips USD/CHF, AUD/USD, 9 pips EUR/CHF, 9 pips NZD/USD.
No stop loss.

Money management position
Martingale setting:
0.01-0.02-0.04-0.08-0.16- 0.32- 0.64- 1.28 high speculative;
0.01-0.02- 0.03- 0.04-0.07-0.011-0.17-0.27-0.43- 0.8. 1.5 (speculative)
Leverage 400:1 or higher.
Minimum account 1500$ for 0.01 microlot.

This system is a good idea for an EA, I hope some programmer do EA and share it here.


In the pictures MA Bands Martingale Trading.
 MA Bands Martingale Trading
MA Bands Martingale Trading
 MA Bands Martingale Trading
MA Bands Martingale Trading
 MA Bands Martingale Trading
MA Bands Martingale Trading
Download
Open Levels Historical.zip
Compressed Archive in ZIP Format 35.5 KB
Download
MA Bands Martingale Trading.rar
compressed file archive 57.1 KB


1:06 PM
thumbnail

Orizzontal Scalping

Posted by larosfx on 21 February 2017

Trend magic with price action and momentum

Submit by GLW 21/02/2017

Orizzontal Scalping is a intraday tecnique based on more trend magic indicators and momentum indicators as Stochastic and Commodity Channel Index. This technique is profitable but you must practice.
This technique is profitable but you must practice.

My advice is to use it on time frame of 15 minutes, then after having learned well you can apply it to the time frames of 5 min.


Time Frame 5 min and 15 min.
Financial markets: any.

This technique can also be used with success on Binary Options high/low.
Expiry time 2-3 candles.

Metatrader Indicators for the template MT4
Trend Magic CC 30, Atr 120, Atr multiple 1.6 (green line);
Trend Magic CC 30, Atr 120, Atr multiple 3.2 (yellow line);
Trend Magic CC 50, Atr 170, Atr multiple 5 (sienna line);
Trend Magic CC 80, Atr 320, Atr multiple 8 (orchid line);
THV4 Pivot levels;
Commodity channel index (5 period) with Stochastic (5,3,3).

Rules for Orizzontal Scalping
Trades only in the direction of the trend.

Buy
Trend Up Condition:
Trend Magic CC 30, Atr 120, Atr multiple 1.6; (green line) > Trend Magic CC 30, Atr 120, Atr multiple 3.2; Trend Magic CC 50, Atr 170, Atr multiple 5; Trend Magic CC 80, Atr 320, Atr multiple 8;
Wait that the price bounces around the area of one of the magic trend indicators. Confirmation with Stochastic that crosses upward and CCI crosses above the line of stochastic.

Sell
Tren down condition
Trend Magic CC 30, Atr 120, Atr multiple 1.6; (green line) < Trend Magic CC 30, Atr 120, Atr multiple 3.2; Trend Magic CC 50, Atr 170, Atr multiple 5; Trend Magic CC 80, Atr 320, Atr multiple 8;
Wait that the price bounces around the area of one of the magic trend indicators. Confirmation with Stochastic that crosses downward and CCI crosses below the line of stochastic.

Exit with fast profit target that depends by currency pairs and time frame or on pivots levels. Initial stop loss on the previous swing.

Tip: The part, more discretionary, of this strategy is to identify when he price bounces around the area of one of the magic trend indicators. Practicing on this aspect.

Especially for trading on binary options.


In the pictures Orizzontal Scalping in action.
Orizzontal Scalping
Orizzontal Scalping
Orizzontal Scalping
Orizzontal Scalping
Download
Orizzontal Scalping.rar
compressed file archive 51.1 KB

8:58 PM